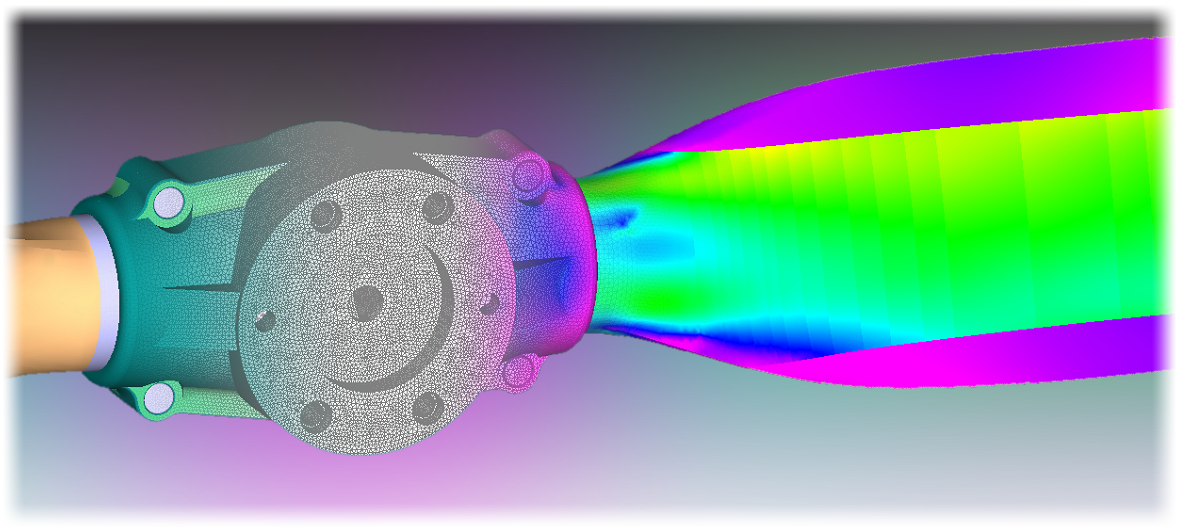
WhirlWind Propellers has the latest technology for manufacturing, computer simulation and experimental tests to design safe, strong, light and efficient propellers.
|
1) Performance, Innovation, Efficiency
|
| The aerodynamics, pressure/velocity profiles, and three dimensional flow patterns through an airboat propeller are an order of magnitude more complex than the airflow acting on an equivalent wing. To optimize propeller thrust and maximize achieved airboat performance, propeller design must balance numerous factors including blade area, aspect ratio, and velocity profile. As such, WhirlWind Propellers employs the most technologically advanced computer flow modeling tools, and incorporates custom designed proprietary airfoil sections from root to tip. Airfoil transitions and blended sections take advantage of the latest understanding and advances in aero-science. Better optimized blade shapes, taper ratios, and thinner, more aggressively tapered tips have been developed by WhirlWind to minimize the induced drag losses that reduce effective engine output and delivered thrust.To ensure that higher performance is actually achieved in real-world conditions, WhirlWind includes the effects of airboat size, shape, speed range, and mission profile in our performance calculations. This data is then incorporated into the final optimized propeller design. For a given diameter, high speed airboat will see an increase in cruise performance from less blade area. Blade twist distribution must be matched to the subject airboat’s speed, engine RPM, and the size and shape of the cowling, so that the discrepancies between theoretical and actual pressures, velocities and flow behaviors are kept to a minimum.Without such a thorough, scientific approach at the design stage, measurable losses in performance will be “built in” over the life of the propeller. |
2) Structural Design and Testing
|
| There are several forces acting upon a propeller in flight, including centrifugal, bending, torsional, and dynamic. Torsional loads, lift loads (thrust), and dynamic loads can combine at certain speed and RPM ranges to create potentially dangerous resonance conditions. WhirlWind Propellers uses an advanced proprietary load simulation program to analyze and predict the forces that create these dynamic vibration and resonance conditions. Based on this data, we are able to optimize the composite layup schedule for each blade design, to deliver the correct balance of strength and stiffness versus flexibility. Propeller structures must have flexural properties to allow limited (and predictable) amounts of movement without approaching a “yield” failure of the composite matrix… but they must also retain enough stiffness to prevent the onset of dynamic resonance or instability.After the initial analysis, WhirlWind uses the latest and most advanced test equipment to verify and physically test each propeller design. First, a ground-based Vibration Survey is used to predict the flight conditions where resonance could occur. Strain gauges are then installed on the propeller blades, and the propeller is flight tested though the entire operational design range plus a safety factor. The strain gauge data validates our engineering process in real-world conditions. Thanks to extensive design and engineering capabilities, backed up by real-world flight testing, WhirlWind Propellers have no “Service Life” limits or restricted operating RPM ranges. |
3) Excellence in Manufacturing
|
| WhirlWind Propellers is proud to be a vertically integrated technology company. We embrace industry-leading best practices in each step of the manufacturing process, and use only the highest quality aerospace materials in the construction and assembly of each propeller. The latest CAD/CAM manufacturing tools ensure that every propeller will meet the original design specifications. WhirlWind uses CNC machined airboat aluminum propeller hubs to maintain precision tolerances. Computer cut pre-preg composite materials guarantee accuracy and consistency in blade laminate structure. Electro-formed Nickel leading edge protection is used to provide unmatched durability and abrasion resistance. WhirlWind also uses all composite core materials; there is no wood to absorb moisture, crack, or change shape over time. Your investment in performance and safety is in the right hands with WhirlWind Propellers. |
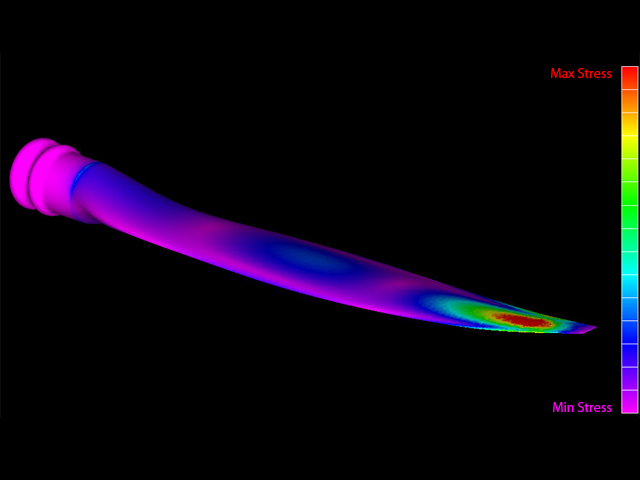
Possible Failure Region
|
Propeller Blade Mode Shape
|
Full Scale Forward Swept (FS) Propeller Blade Test
WhirlWind Propellers had developed a full scale forward swept (FS) propeller blade for proof of concept testing. This is the first full scale forward swept (FS) propeller blade to be manufactured and tested (that we are aware of). The FS Propeller is currently in testing phase and we will share the results. Testing will focus on noise reduction and efficiency increases.
For decades the theoretical benefits of forward swept propeller blade designs have been discussed in the aerospace engineering community. Testing of wind tunnel models and CFD models have shown potential performance improvements and noise reduction for the forward swept propeller blade design. Aerodynamic tip losses plague propeller efficiency and performance, and the forward swept design attempts to address those losses. There have been several attempts to address tip losses using other propeller blade design modifications, such as winglets and fences, but these types of modifications have actually resulted in more drag on the propeller blade and loss in performance.
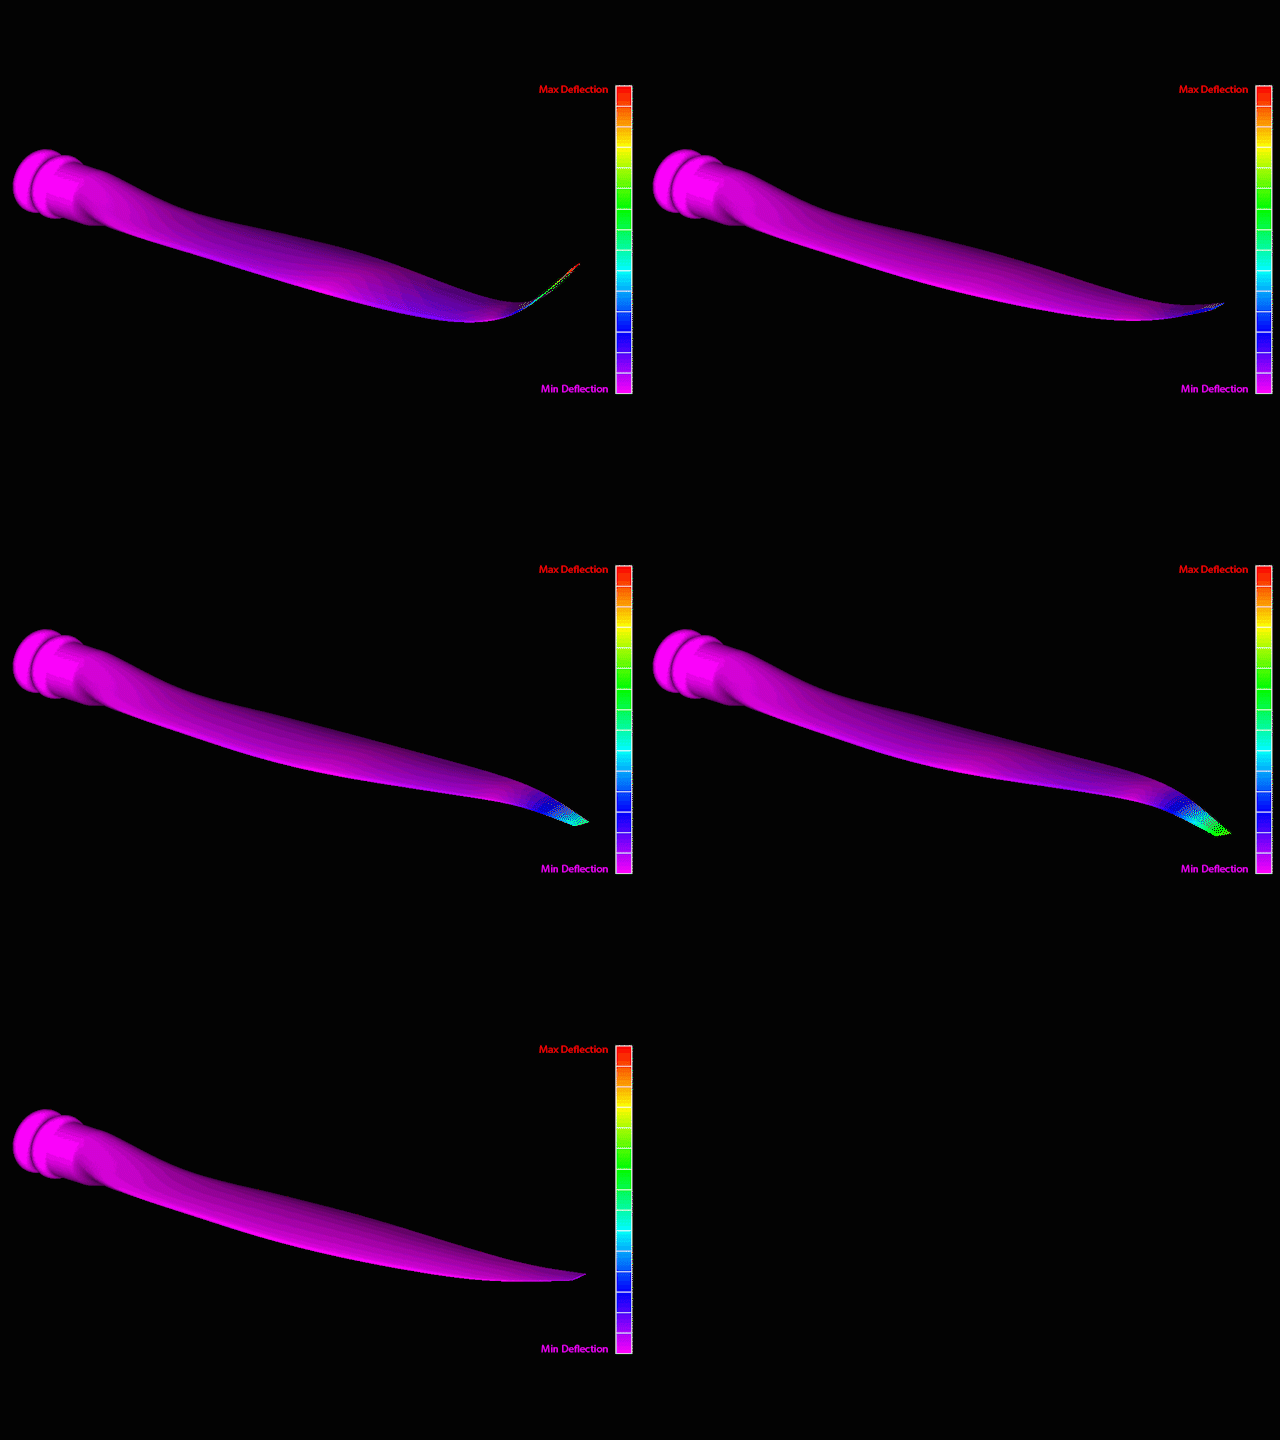
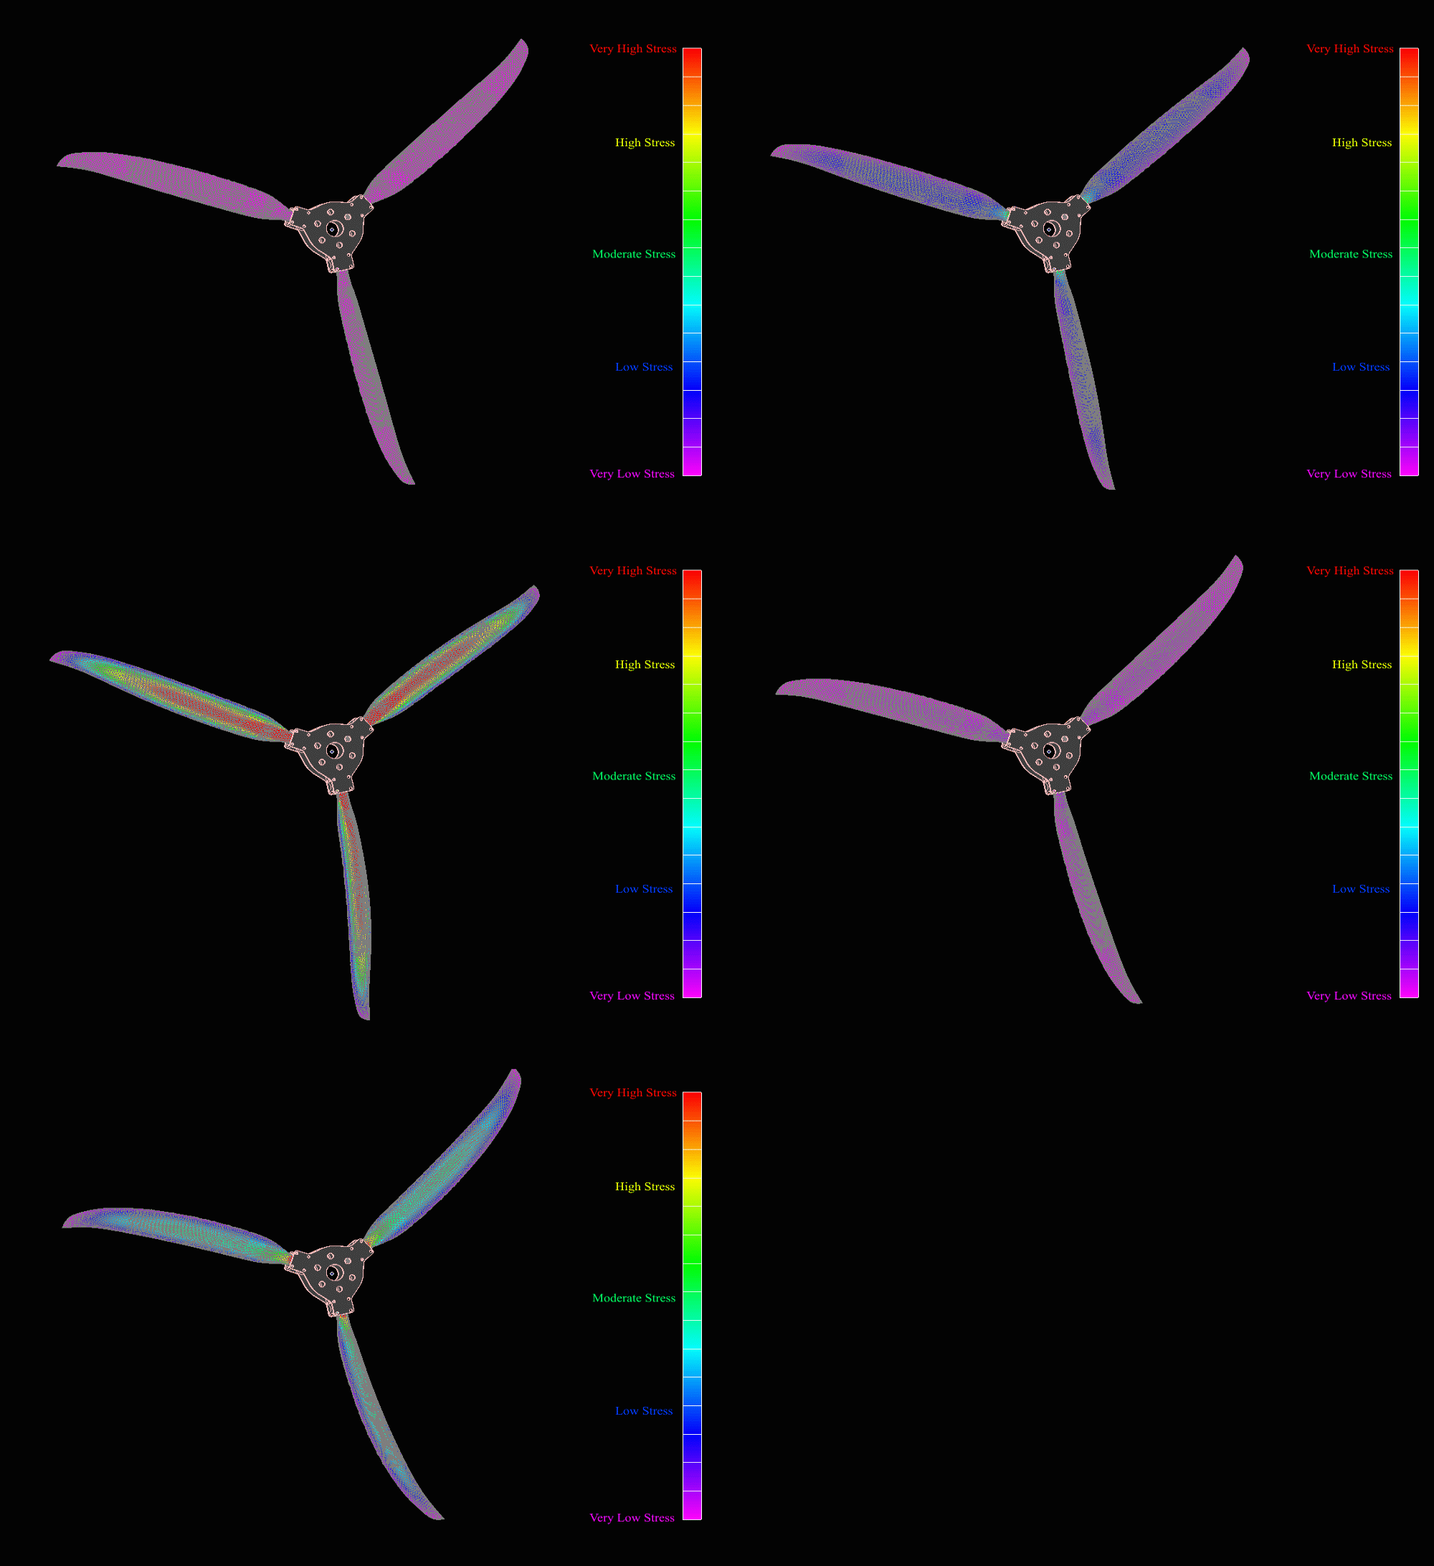
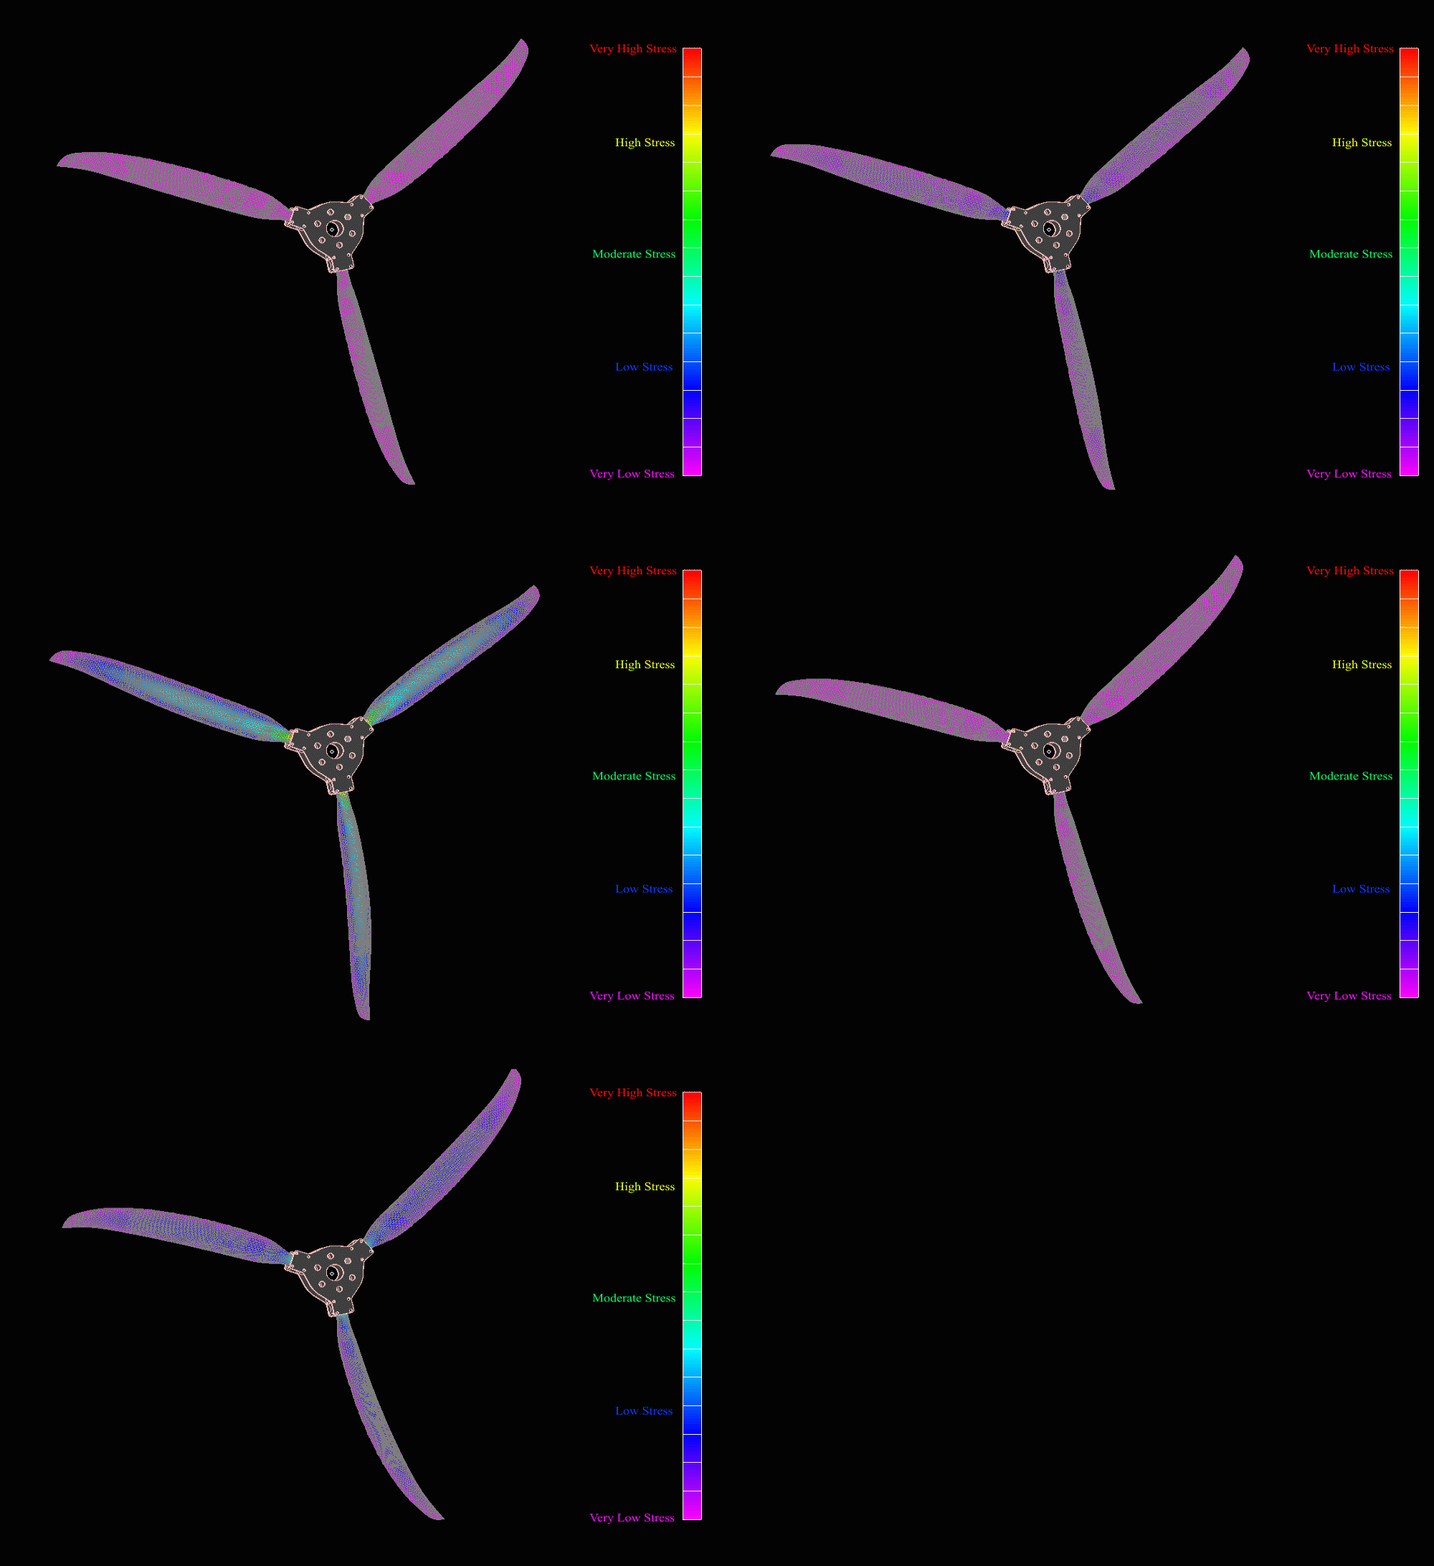
A Comparison of Blade Deflection and Stress Distribution Simulation with and without Engine CounterweightsThe comparison is made for and engine rotation of 2700 RPM. In the plots, the rotation of the propeller is not displayed, only the blade deflection and stress distributions are shown. |
Without Engine Counterweights
|
With Engine Counterweights
|
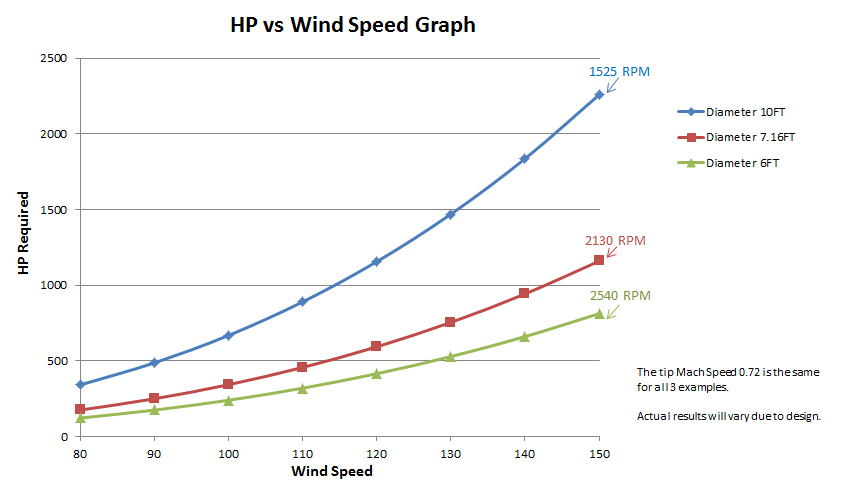
A representation graph of propeller RPM/HP to Thrust |
 |
Debunking Horsepower and Torque Myths |
Torque is all that counts! I’ve got more horsepower, that’s what counts! I’ve got good low-end power, that’s what counts!There is a lot of discussion among motor enthusiasts regarding horsepower and torque – resulting in heated conversations containing misconceptions and errors. This article explains how torque and horsepower are related, and exposes some of the common misconceptions.
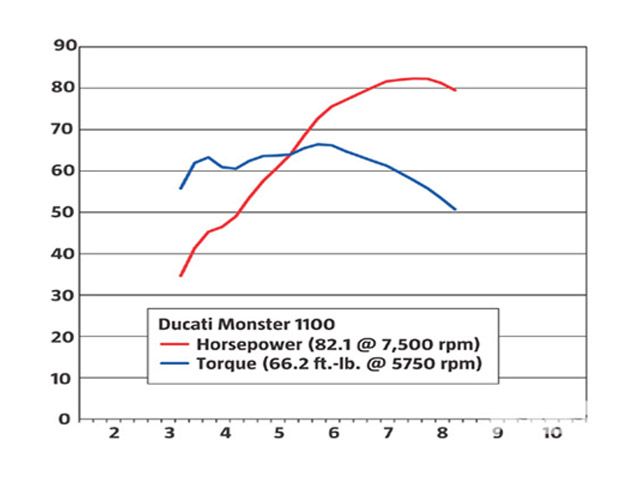
What is torque, and what is horsepower?First, what is torque? Torque is a twisting force on an object. If you have ever used a torque wrench, you can relate to this. The torque wrench reads how many foot-pounds of force that you are exerting on the shaft. If the handle on your wrench is one foot long, and you place one pound of pressure on the end of the wrench, you have exerted one ft-lb of torque on the shaft (just multiply the force exerted by the length of the handle). When you use a torque wrench, the shaft that you are twisting (typically a bolt or nut) is stopped when you reach the desired torque, but the torque can be applied equally as well to a rotating shaft. Envision the bolt never tightening up (oh no, did I strip it!), but with force being applied as it spins around. Torque has no sense of speed in its measure, only the amount of twisting force being applied. In the last few years, it has been common to refer to torque in pound-feet rather than foot-pounds. If that is torque, then what is horsepower? Horsepower is a measure of work. The amount of work that is performed is not only related to the force applied, but the speed at which the force is being applied. A unit of work is ft-lbs/sec. You can think of it as a combination of rate and force. Let’s say that you are loading the back of your pickup with rocks. The bed is two feet high, and you lift six fifty-pound rocks in one minute. You have done 2 feet x 300 lbs / 60 seconds = 10 ft-lbs/sec of work. A horsepower is 550 ft-lbs/sec, so you have exerted 10 / 550, or .018 horsepower of work. So, now let’s say that you work twice as fast, and lift 12 rocks in a minute in place of the 6. You have now loaded your pickup using .036 horsepower. Note that in both cases, you have exerted the same torque (force) when lifting each rock of 2 ft x 50 lbs = 100 ft-lbs. In the second case, however, you did twice as much work (horsepower) with the same amount of torque. This is because the torque was occurring at a higher rate of speed. So what’s the relationship between horsepower and torque when we talk about engines? Horsepower = speed (RPM) x torque (ft-lbs) / 5252 To find the horsepower at any given RPM, multiply the torque at that RPM by the RPM, then divide by 5252. This will generate a horsepower curve by calculating the horsepower at various RPMs. Find the peak of this curve (the highest horsepower number), and that is the horsepower rating of the engine. Depending upon the torque curve of the motor, maximum horsepower may occur at low or high RPM. Generally it is near the maximum RPM of the engine. What’s the implication of this? Let’s say it takes 150 horsepower to go up a hill at 70 MPH. You have two rigs, one a diesel with 400 ft-lbs of torque at 2000 RPM. At 2000 RPM, it is generating 150 horsepower, and will go up the hill at 70 MPH. You have another gasoline-engined rig that generates 200 ft-lbs at 4000 RPM, which is also 150 horsepower. So, it can go up the hill at 70 MPH too, with half the torque of the diesel. So… Myth 1: An engine with more torque “pulls” better.What’s the difference in the previous example? Doesn’t torque make you go up the hill? The difference is in the gearing of the rigs. The diesel-rig probably has overall gearing like 2.28:1 (with a redline below 3000 RPM you need high gearing!), and the gas-engined rig has overall gearing more like 4.56:1. Even though the torque of the engines are vastly different, after compensating for the gear ratios of the differential and transmission, the torque at the rear axle is the same. After correcting the gearing to operate within the operating RPMs of each engine, the lesser torque of the higher-speed engine is multiplied to be the same. So it isn’t engine torque that decides how fast you go up the hill, it is horsepower. However, not all engines of the same peak horsepower are completely equal. For example, the horsepower curve may be flatter (as a percentage of RPM) on one engine than the other. While both may be exactly the same performance at peak horsepower, the engine with a flatter horsepower curve may give better performance because when you shift from gear to gear you have higher average horsepower. Generally, when people talk about an engine being “torquey” they really are thinking that it has a wide power band. An example of a peaky motor might be one with 300 horsepower at its peak RPM of 4000, but it only has 200 at 3500 and 4500 RPM. A “torquey” engine with the same maximum horsepower might have 250 horsepower at 3500 and 4500 RPM, and not drop down to 200 horsepower until at an even wider RPM band. Myth 2: For best acceleration, you should shift at redline or max torque or max horsepower or…None of these are exactly true, but redline is probably the closest guess of the three. You could derive a fancy equation involving the integral of the area under the horsepower curve between the RPM points of the two gears at the shifting speed, but as a practical matter you want to go past the peak horsepower RPM, then shift when the horsepower in the present gear decreases to be equal to the horsepower of the RPM after you shift to the new gear. In many cases this may be near redline, but not always. It depends on what gear you are in and how many RPM are lost when you shift. For example, let’s say you know that you have peak horsepower at 4000 RPM, and when you shift from 2nd to third in that RPM region, there is a 1000 RPM drop. Consequently, you should shift at 4500 so that after the shift you are going 3500 — the same amount of RPM above peak as below peak horsepower. In this case the average RPM is roughly equal to the peak horsepower. This assumes that the shape of the horsepower curve is about the same on both sides of the peak, and while not exactly correct, is pretty close in most cases. Myth 3: A well-tuned engine is has equal torque and horsepower at about 5250 RPM.Let’s look at the horsepower formula: Horsepower = torque x RPM / 5252. If your engine can exceed 5252 RPM, the torque and horsepower MUST be equal at 5,252 RPM. It isn’t a matter of tuning, it is a mathematical given. That’s one of the reasons diesel manufacturers like to talk about torque. If a motor’s maximum RPM is under 5,252, the torque figure is going to be higher than the HP figure – so it sounds better. For example, here’s a chart showing both horsepower and torque for a Ducati Monster. The torque/HP numbers are shown on the Y-axis, and RPM is shown on the X-axis:
You might see a chart with the torque/horsepower curves crossing at a much lower RPM. This is the case if torque is shown in Newton-Meters, and is an artifact of the way the calculations work with this different unit system. Myth 4: An engine that has more torque than horsepower is better for towingAgain, depending on the overall gear ratio, horsepower is the most important measure. Because of the math, an engine that is tuned to have peak horsepower below 5252 RPM will ALWAYS have more torque than horsepower, and engines with peak horsepower above 5252 RPM will ALWAYS have more horsepower than torque. However, other factors when towing, such as fuel economy, probably tip thes scales toward the lower RPM (e.g., diesel) powered vehicle. Myth 5: For best fuel economy, you should drive at the RPM of the engine’s maximum torqueI saw this myth in a magazine recently. For maximum fuel economy, you should drive at the lowest RPM that has enough horsepower to go the speed you wish. Imagine the engine as a big air pump that brings in air through the carburetor and sends it out the exhaust. The fuel likes to be at the stoichiometric fuel-air ratio of 14.7:1. So the lower the RPM you are at, the less fuel you are going to use. Of course a vehicle with twice the displacement, but half the RPM will be equivalent. Horsepower can also be related to the electrical realm. 746 Watts is the equivalent of one horsepower. So, if you had a one horsepower engine driving a generator (with no loss), it would illuminate five 150-Watt bulbs. Think about this next time you read horsepower claims of motors, vacuum cleaners and compressors: a typical 115-Volt circuit with a 15A breaker can theoretically generate a maximum of 2.3 horsepower. This is if there are no losses in the translation. As a practical matter, a standard 115 Volt circuit can’t even generate 2 horsepower with the inevitable losses due to friction, inefficiency, amd heat losses in the translation. In summary, there are a lot of misconceptions about horsepower and torque. Remember that it depends on the gearing, horsepower and flatness of the horsepower curve – but very little on the torque number by itself. If two engines have the same horsepower, with the proper gearing they will perform very similarly, but the same general statement can’t be said for two engines of the torque.
|
|
Tooling Progress for Whisper Tip 68 composite airboat propeller blade
|
